
I’ve seen enough. A recession has started. Let’s discuss starting with a very good indicator that has few false positives and no false negatives.
What is the McKelvey Recession Indicator?
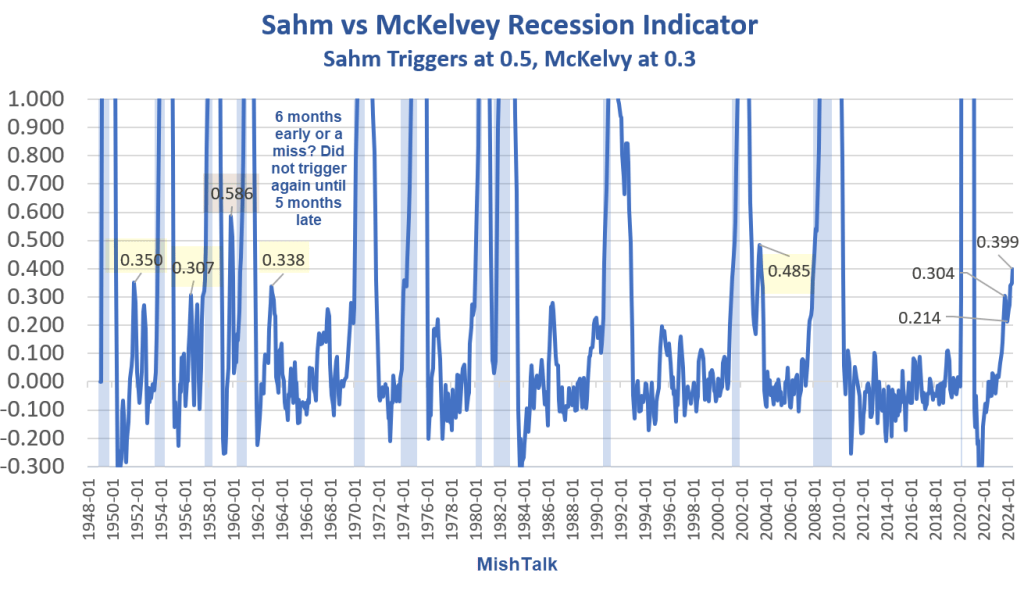
Take the current value of the 3-month unemployment rate average, subtract the 12-month low, and if the difference is 0.30 percentage point or more, then a recession has started.
Claudia Sahm, a former Federal Reserve and White House Economist, changed the indicator from 0.3 to 0.5.
Please consider The Sahm Rule: Step by Step written December 7, 2023 by Claudia Sahm.
I created the Sahm rule, and it’s on me to communicate it well. I try. If you have any questions, please add them to the comments.
Sahm claims to have invented the rule. However, credit should go to Edward McKelvey, a senior economist at Goldman Sachs.
False Positives
To eliminate false positives, Sahm modified the original McKelvey rule from 0.3 to 0.5 but the result is a much larger lag time negating her claim of “real time”.
At 0.5 Sahm eliminates all but one false positive (none if you discount the one and only time the indicator was early, and then by six months).
A trigger of 0.3 produces five false positives, albeit only one since 1964. If October of 2023 is false, that makes six false positives.
Using a trigger of 0.4 results in only two false positives with an average lag of ~1 month.
McKelvey June 2023-Present
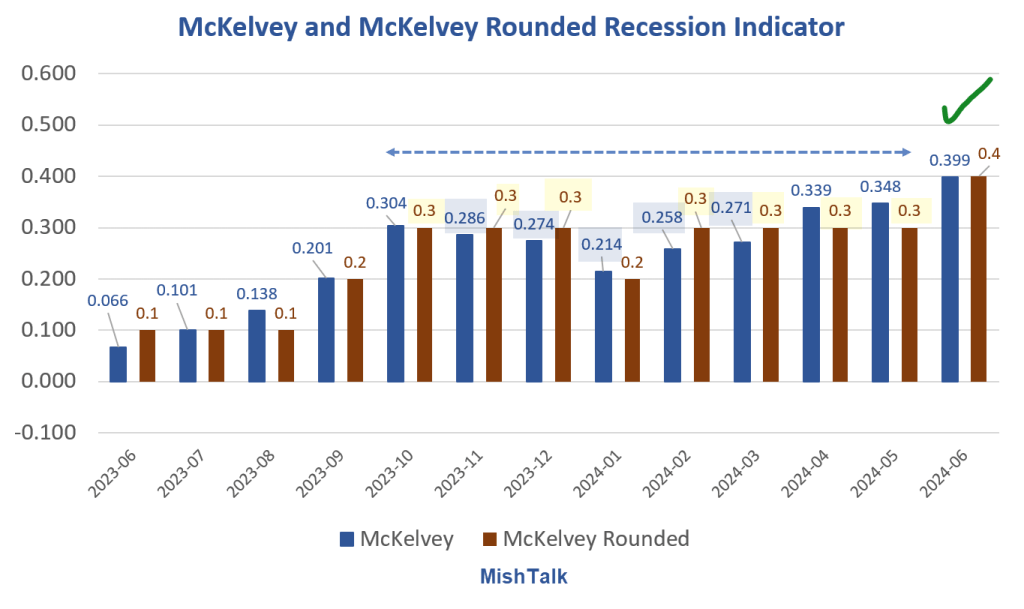
At 0.3 we had a weak McKelvey trigger in October but the signal quickly faded below 0.3 for the next five months not resurfacing until April.
Using a compromise 0.4 trigger we have as signal for June, although barely. It’s 0.399 to three decimal places.
Using a fatter crayon of 0.35 we had a weak signal in May, and a stronger one in June.
Calculation Methodology
In her step-by step-example, Sahm takes a one-decimal place input and derives a two-decimal place output, a mathematical non-no.
I calculate the unemployment rate directly to three places, then round in my charts.
For example, for June of 2024, Sahm uses one-decimal unemployment rates of (3.9, 4.0, and 4.1), then calculates a two-decimal output of 0.43. Sigh. I rather doubt this is what McKelvey intended, but that’s a guess.
I calculate unemployment rates of 3.865, 3.964, and 4.055 yielding a slightly lower McKelvey number of 0.399 best thought of as 0.40 if not 0.4 (one decimal place rounded).
This entire exercise is a bit of silliness because the unemployment rate is not accurate to the degree that dedication to any specific number depends on.
Rather than a “rule”, McKelvey is best thought of as an early warning indicator. Using 0.3 as a warning signal (or better yet ~0.35 calculated properly, seems about right).
Using 0.50 is so purposely tight to eliminate false positive that it provides no useful warning in most cases.
October Looks Doubtful
I don’t believe a recession started in October.
Nonetheless, I salute Danielle DiMartino Booth for discussing the indicator at a time no one else was remotely interested in the recession idea (and most still aren’t).
It was this Tweet that piqued my interest in the indicator.
Recession Lead Times in Months, McKelvey vs Sahm
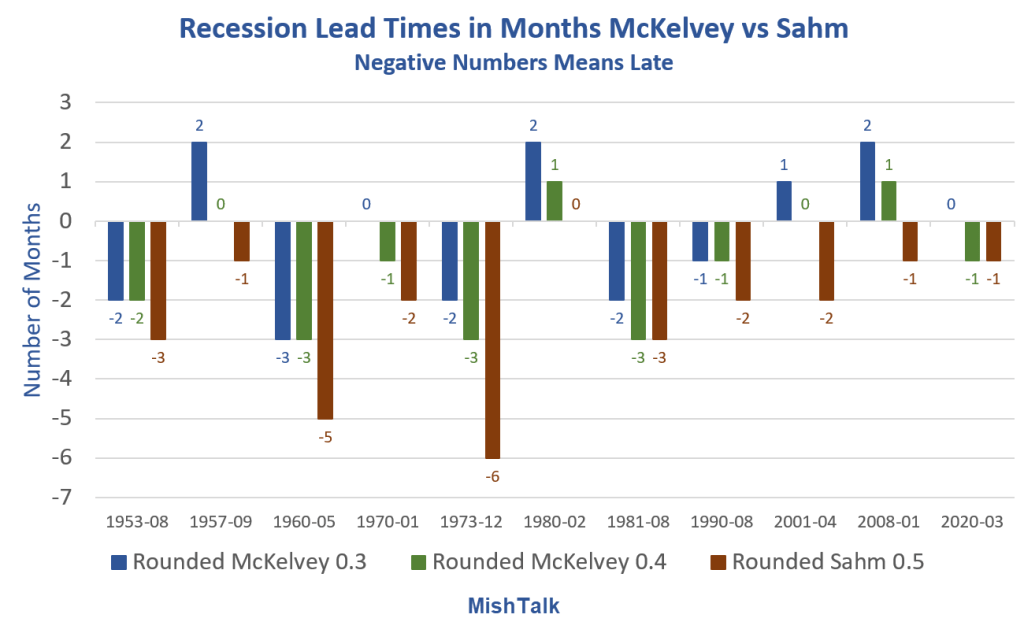
Using a trigger of 0.4 instead of 0.3 produces similar results to 0.3 but with only two false positives instead of five or six (depending on how October is treated and also assuming a recession is underway or soon at hand).
Also using 0.4 as the trigger, the sum of the lags is 12 months in 11 recessions, with two leads of one month and two right on time. That makes the average lag ~1 month.
At 0.40 a recession just triggered for June. At 0.35 a recession triggered in May. Importantly, for five straight months the signal has strengthened. This is unlike October of 2023.
Very Weak Economic Data
On July 1, I commented A String of Very Weak Economic Data Sinks the GDPNow Forecast emphasis added.
I am increasingly confident a recession has started or soon will. Yet despite weak data, Treasury yields rose. What’s happening?
GDPNow Chart Notes
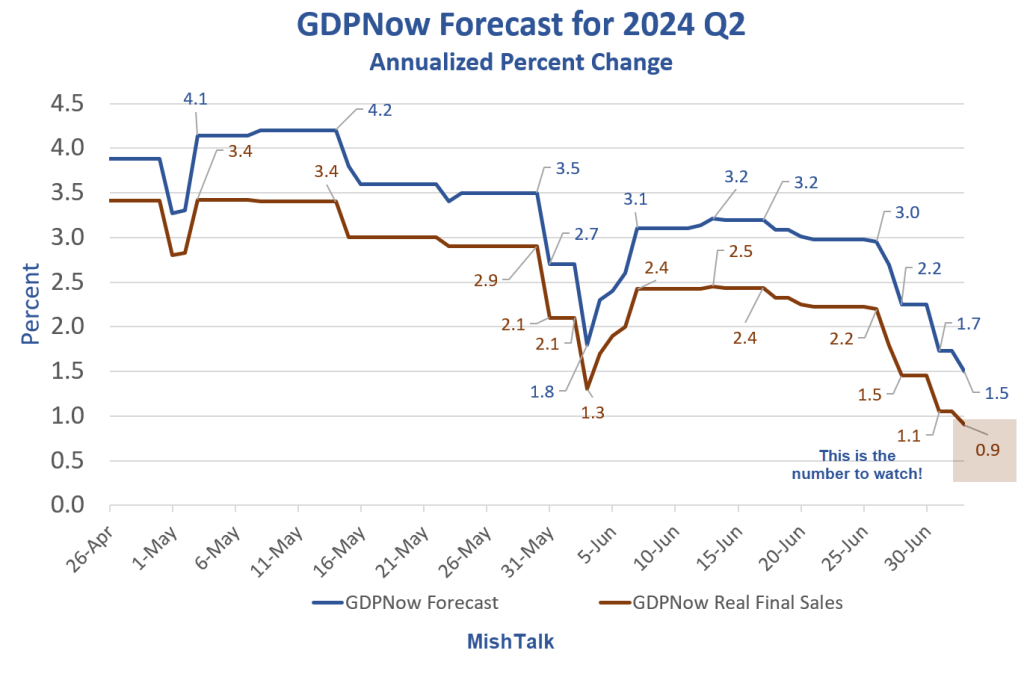
- The base forecast is in blue. It’s the one most observers watch but shouldn’t.
- Real final sales, in red, is the bottom line estimate of the economy.
- The difference between the two line is Change In Private Inventories (CIPI) which nets to zero over time.
The NBER, the official arbiter of recessions, uses real final sales as part of its recession decision process, not the base GDP report.
On July 3, I commented Weakness in ISM Services and Manufactured Goods Hits GDPNow Forecast
The GDPNow forecast took another dip today with the key item, Real Final Sales, now at 0.9 percent [and falling fast].
Jobs Much Weaker than Expected, the Unemployment Rate Ticks Up
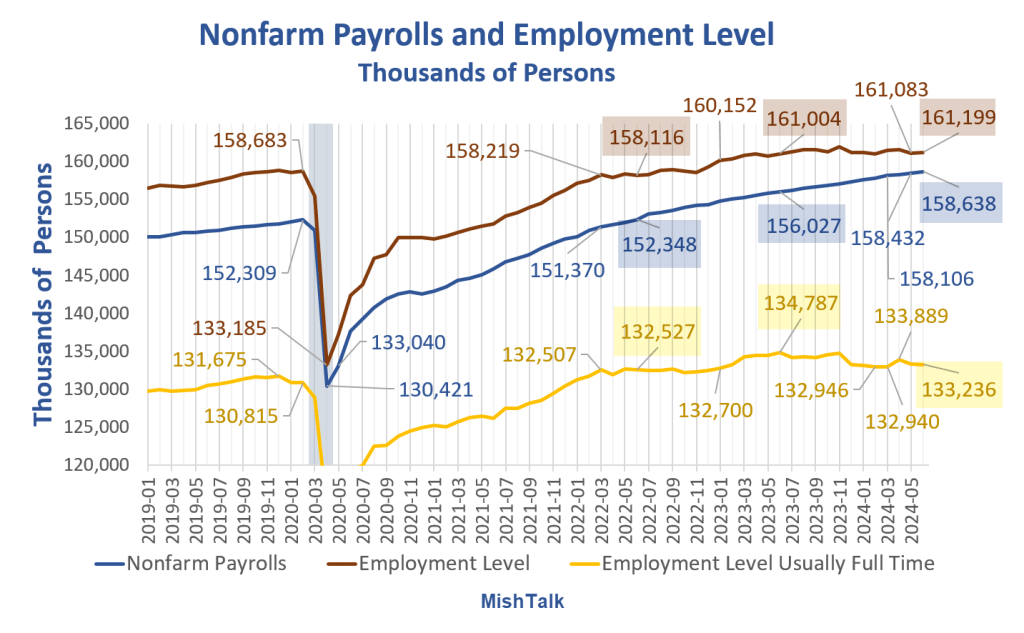
On July 5, I commented Jobs Much Weaker than Expected, the Unemployment Rate Ticks Up
Counting negative revisions, there was unexpected weakness across the board in June, especially private and manufacturing payrolls.
On the assumption that weakening data will continue to weaken further and there will not be a miracle save by the Fed or White House, this economy is toast.
Mish, Aren’t You Always Early?
That’s a fair question. I even called a recession somewhat recently that did not happen.
So did most economists, but I was much more vocal and insistent about it.
Admit mistakes and move on.
I should have paid attention to Bob Farrell’s Rule #9: When all the experts and forecasts agree, something else is going to happen.
Let’s discuss the “something else” that did happen to kill the expected recession.
Tax Cuts Explain Surge in Consumer Spending in 2023
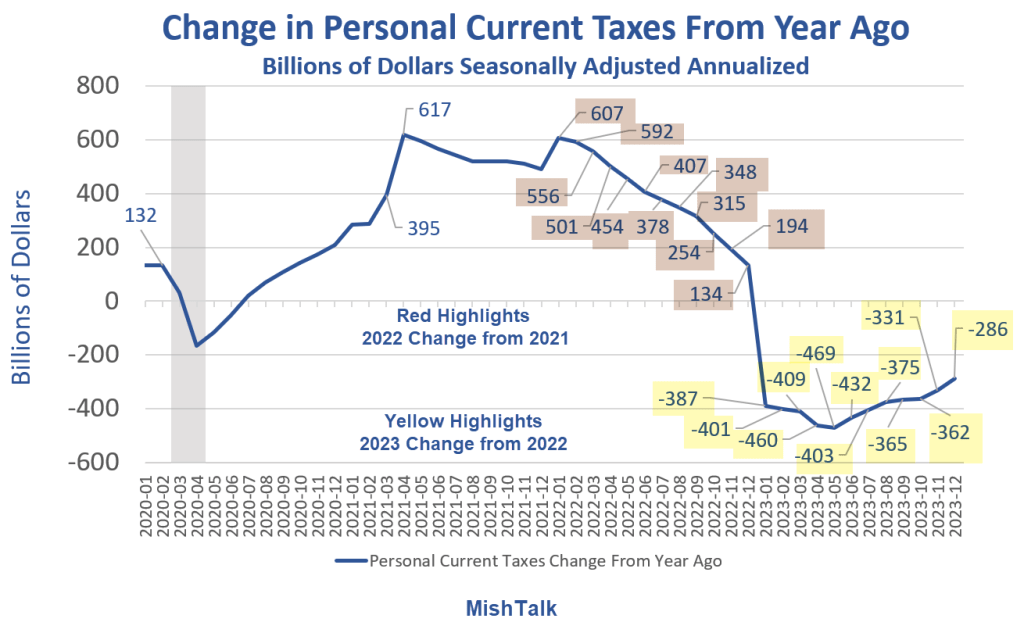
On January 29, 2024, I commented Tax Cuts, Not Bidenomics Explains Surge in Consumer Spending in 2023
Also, on January 1, 2023, 38 states had noteworthy tax changes. 37 of those changes put extra money in people’s pockets.
The combination of big wage increases, plus tax cuts, plus Inflation Reduction Act spending murdered the then-pending recession.
What about now?
Weakness Everywhere
There is weakness in housing (new home sales, existing home sales, and starts at the lowest in 4 years), consumer spending, manufacturing (both durable and nondurable good), jobs data (constant negative revisions, QCEW, major survey discrepancies, quits, and a rising unemployment rate), and finally we have major unexpected ISM Services in Contraction.
All of the above items are hard data other than the services ISM.
There is no savior on the horizon this time. The Fed rates to be inactive until it panics in September and that will be much too late to stop a recession that started in May or June.
In contrast to what happened in 2023, only two of us (at least that I am aware of) are vocal about a recession being underway or even likely this time.
Thanks Danielle and Bob Farrell with an emphasis on Note #9.
When Did Recession Start?
I suggest May based on a McKelvey 0.4 trigger and an average lag of about a month.
This also corresponds to more pronounced weakness in many major economic reports.
Click on numerous links in the Weakness Everywhere paragraph above for specific examples.
mexican drugstore online: buying from online mexican pharmacy – mexican pharmaceuticals online
mexican online pharmacies prescription drugs
semaglutide https://rybelsus.tech/# Semaglutide pharmacy price
rybelsus cost
semaglutide online: buy semaglutide pills – buy semaglutide online
https://rybelsus.shop/# rybelsus coupon
rybelsus price: rybelsus cost – semaglutide cost