
The BLS reports payroll employment rises by 254,000 in September. I discuss two reasons the report is suspect.
Jobs vs Employment
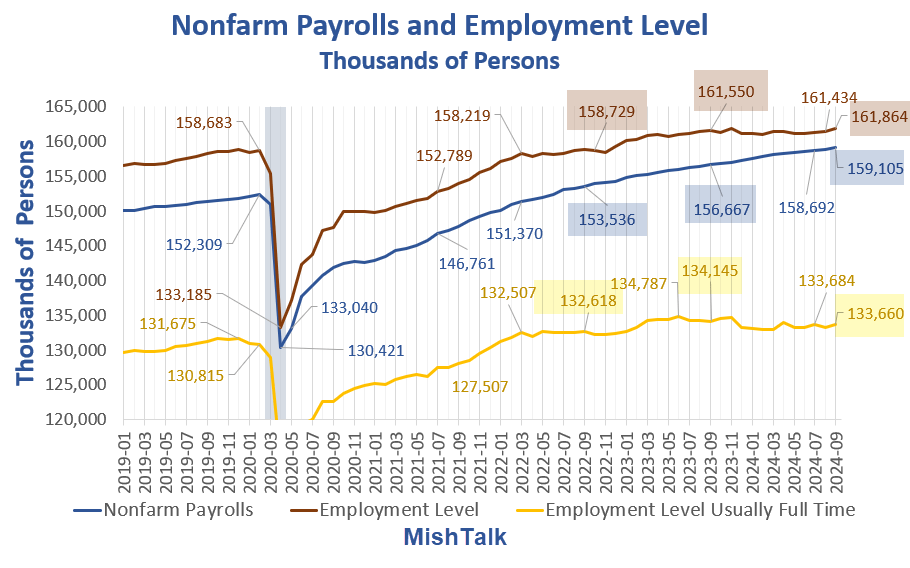
From September 2020 through early 2022, nonfarm payroll job gains and full time employment changes tracked together.
Starting around March of 2022, a divergence between employment and jobs became very noticeable, and I have been discussing the divergence since then.
Job Stats vs One Year Ago
- Nonfarm Payrolls: +2,438,000
- Employment: +314,000
- Full Time Employment: -485,000
Job Stats vs Two Years Ago
- Nonfarm Payrolls: +5,569,000
- Employment: +3,135,000
- Full Time Employment: +1,042,000
In the last year, nonfarm payrolls are up by 2.4 million while employment is only up by 314,000 and full-time employment is down by 485,000.
Job Report Details
- Nonfarm Payroll: +254,000 to 159,105,000 – Establishment Survey
- Civilian Non-institutional Population: +224,000 to 269,080,000
- Civilian Labor Force: +150,000 to 168,699,000 – Household Survey
- Participation Rate: +0.0 to 62.7% – Household Survey
- Employment: +430,000 to 161,864,000 – Household Survey
- Unemployment: -281,000 to 6,834,000- Household Survey
- Baseline Unemployment Rate: -0.1 to 4.1% – Household Survey
- Not in Labor Force: +75,000 to 100,381 – Household Survey
- U-6 unemployment: -0.2 to 7.7% – Household Survey
Nonfarm Payroll Change by Sector
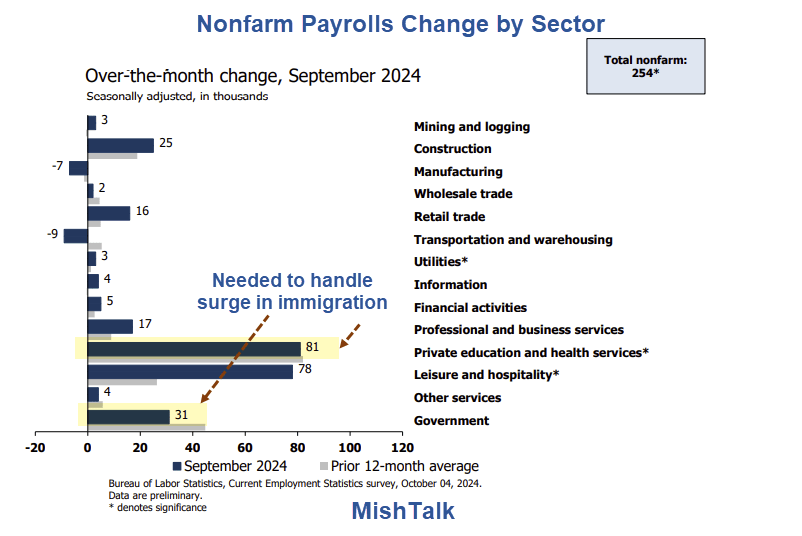
Government and Health Services are related to the surge of illegal immigrants and the need to address them.
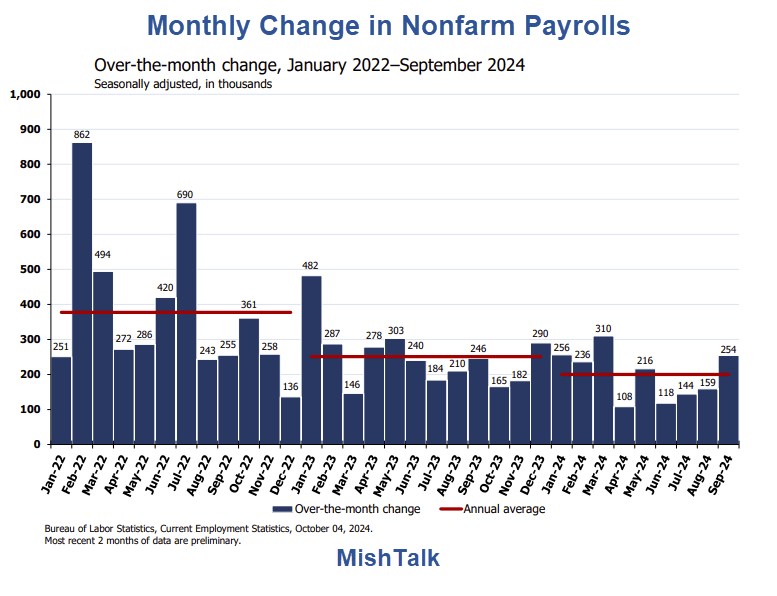
Monthly Change in Nonfarm Payrolls
Monthly Revisions
- The change in total nonfarm payroll employment for July was revised up by 55,000, from +89,000 to +144,000
- The change for August was revised up by 17,000, from +142,000 to +159,000.
- With these revisions, employment in July and August combined is 72,000 higher than previously reported.
Nearly every month there are negative revisions. Today we have rare positive revision.
Part-Time Jobs
- Involuntary Part-Time Work: -206,000 to 4,624,000
- Voluntary Part-Time Work: +5,000 to 22,566,000
- Total Full-Time Work: +414,000 to 133,660,000
- Total Part-Time Work: -95,000 to 28,161,000
- Multiple Job Holders: +121,000 to 8,659,000
The above numbers never total correctly due to the way the BLS makes seasonal adjustments. I list them as reported.
It’s important to not that multiple jobs are additive to nonfarm payrolls but not the number of employed.
Hours and Wages
This data is frequently revised.
- Average weekly hours of all private employees fell 0.1 hour to 34.2 hours.
- Average weekly hours of all private service-providing employees fell 0.1 hour to 33.1 hours.
- Average weekly hours of manufacturers was flat 40.0 hours.
An overall decline or rise of a tenth of an hour does not sound line much, but with employment over 160 million, it’s more significant than it appears at first glance.
Hourly Earnings
This data is also frequently revised. Here are the numbers as reported this month.
Average Hourly Earnings of All Nonfarm Workers rose $0.13 to $35.36. A year ago the average wage was $34.01. That’s a gain of 4.0%.
Average hourly earnings of Production and Nonsupervisory Workers rose $0.08 to $30.33. A year ago the average wage was $29.18. That’s a gain of 3.9%.
Year-over-year wages are keeping up with year-over-year inflation after underperforming for many months.
Unemployment Rate
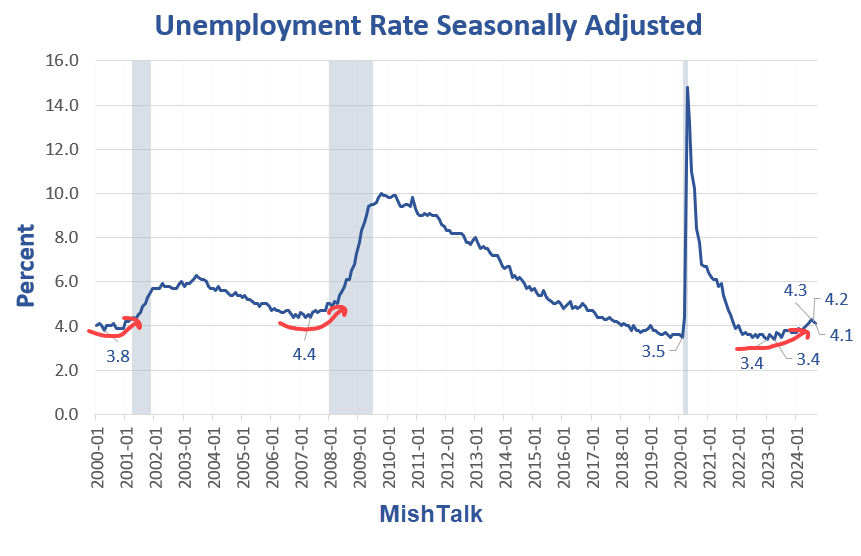
The unemployment rate hit a 50-year low in January and April of 2023 at 3.4 percent. It’s now 4.1 percent.
“The unemployment rate has bottomed this cycle and will generally head higher.”
I first made that comment many months ago. If there was any doubt, it’s now erased.
Alternative Measures of Unemployment
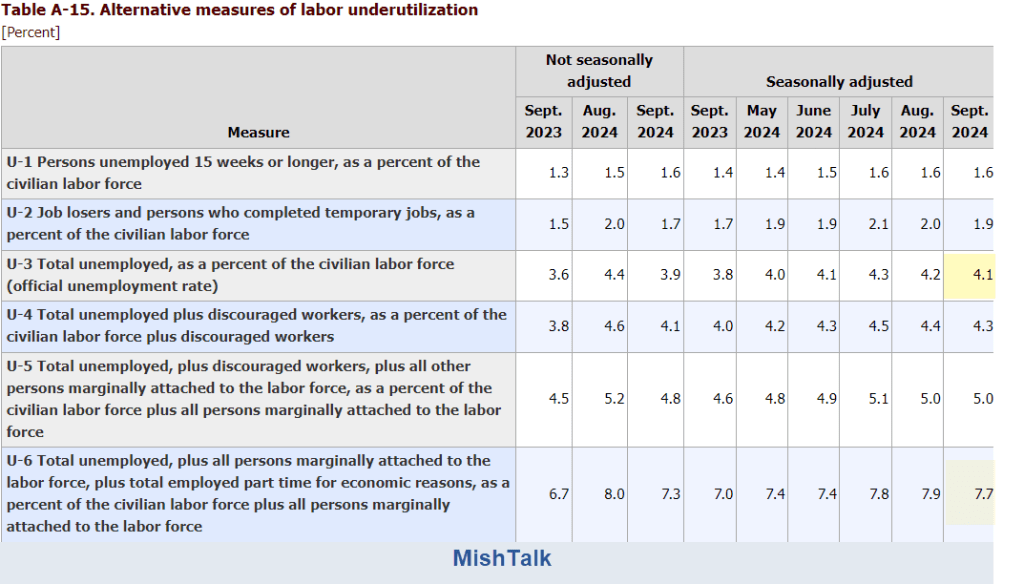
Table A-15 is where one can find a better approximation of what the unemployment rate really is.
- The official unemployment rate is 4.1 percent.
- U-6 is much higher at 7.7 percent.
Both numbers would be way higher still, were it not for millions dropping out of the labor force over the past few years.
Some of those dropping out of the labor force retired because they wanted to retire. Some dropped out over Covid fears and never returned. Still others took advantage of a strong stock market and retired early.
The rest is disability fraud, forced retirement (need for Social Security income), and discouraged workers.
Birth Death Model
Starting January 2014, I dropped the Birth/Death Model charts from this report.
The birth-death model pertains to the birth and death of corporations not individuals except by implication.
For those who follow the numbers, I retain this caution: Do not subtract the reported Birth-Death number from the reported headline number. That approach is statistically invalid.
Birth-Death Methodology Explained
I gave a detailed explanation of the model and why the hype is wrong in my June 8, 2024 post How Much Did the BLS Birth-Death Adjustment Pad the May Jobs Report?
I repeat, do not subtract the birth-death number from the headline number. That’s flawed.
However, it is now clear that the BLS is too optimistic about the number of jobs they believe are being created by the net creation of new businesses.
A Breakdown, by Sector, of the Negative 818,000 BLS Job Revisions
On August 22, 2024 I gave A Breakdown, by Sector, of the Negative 818,000 BLS Job Revisions
Those negative revisions are a direct result of the BLS Birth-Death model gone haywire.
Household Survey vs. Payroll Survey
- The payroll survey (sometimes called the establishment survey) is the headline jobs number. It is based on employer reporting.
- The household survey is a phone survey conducted by the BLS. It measures employment, unemployment and other factors.
If you work one hour, you are employed. If you don’t have a job and fail to look for one, you are not considered unemployed, rather, you drop out of the labor force.
Looking for job openings on Jooble or Monster or in the want ads does not count as “looking for a job”. You need an actual interview or send out a resume.
These distortions artificially lower the unemployment rate, artificially boost full-time employment, and artificially increase the payroll jobs report every month.
Recent Economic Data
September 30: Housing Starts Are Tumbling as Completions Soar, It’s Very Recessionary
October 1: Job Quits Drop Again, Well Below Pre-Covid Levels
October 1: ISM Manufacturing Contracts 6th Month, 22nd Time in 23 Months
Final Thoughts
This was the strongest payroll report in months. But people taking second jobs added 121,000 to the headline number.
Also, the report is suspect. On August 22 I noted A Breakdown, by Sector, of the Negative 818,000 BLS Job Revisions
The BLS Birth-Death model has gone haywire resulting in mammoth negative revisions.
And yesterday, ADP data shows Small Businesses Reducing Workers for the Last Five Months
In addition to a flawed birth-death model, I strongly suspect the BLS is oversampling large employers or underweighting small businesses. See above link for details.