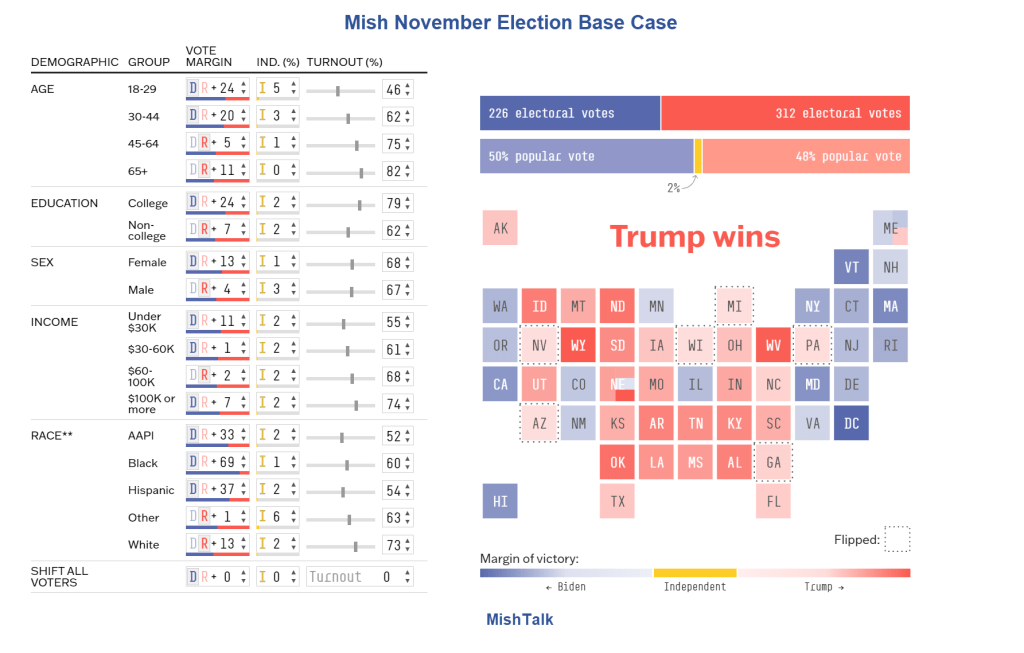
At least four sites have interactive maps that let you make changes to determine who will win in November. My lead chart represents my base case. Economics explains why.
Interactive Websites and Features
- 270toWin: The 270toWin site lets you change states at will. But it offers no parameters you can change to see the impact. This is not a serious site for playing “What If”.
- RaceToTheWH: RTTWH is a sprawling site with various interactive features. The sprawling nature of the site makes things complicated. The link shown lets you adjust the national vote for Trump or Biden. But national trends will not decide the election.
- Wall Street Journal: The WSJ site is paywall protected. It lets you adjust education, race, gender, age, and turnout. And it lets you adjust for third-party votes. But all the adjustments are at the national level.
- 538 Nate Silver: 538 is easier to use than WSJ. And it’s free. But like the WSJ, it does not let you select states individually.
Recommendations
If you are going to play around interactively, start with 538. If you want an up-to-date forecast try RTTWH.
First, you need a set of polls that breaks things down by education, race, gender, age, turnout, and third-party votes.
National trends will not decide this.
Swing State Polls
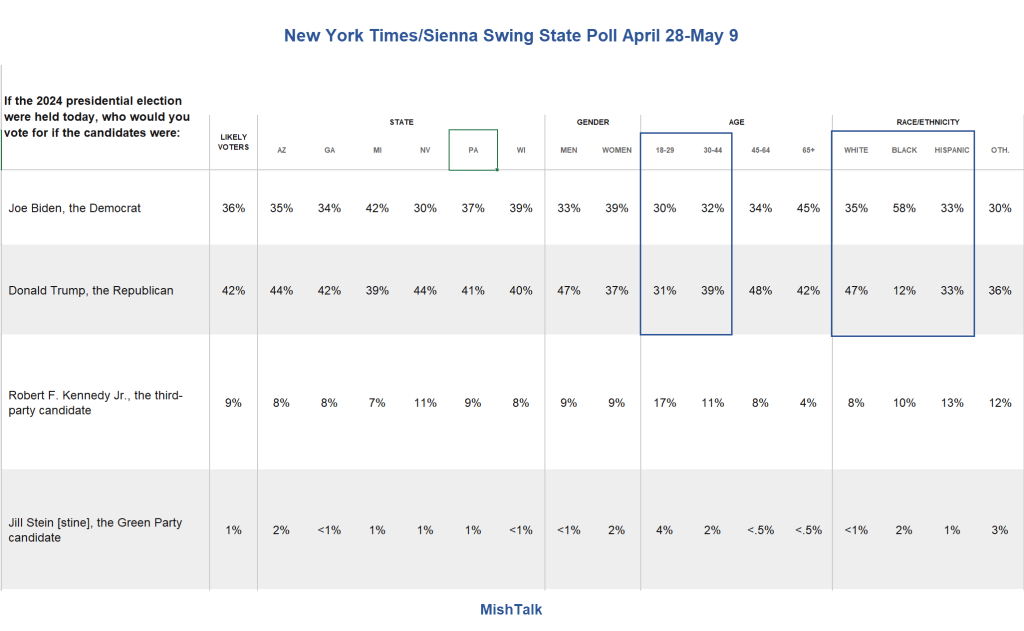
I started with the New York Times/Siena Likely Voter Poll of the Presidential Battlegrounds from April 28 to May 9.
However, starting with the above poll and applying the percentages at the national level gives entertaining but laughable results.
For example, Trump won California. In fact, Trump won every state but Hawaii, Massachusetts, DC, and Vermont.
That won’t happen. So we really do need breakdowns by state.
Also, Income data is going to be very hard to find. So 538 needs to remove that parameter and adjust accordingly.
Starting All Over
Starting all over, I played around with finding the minimum change consistent with the NYT polls that would give Trump the win.
For example, consider age groups 18-29 and 30-34.
Biden clobbered Trump in 2020 in age group 18-29 by 29 percentage points and age group 30-34 by 24 percentage points. In the swing states, Trump is ahead!
The 2020 election had Biden ahead of Trump with Black voters by a whopping 82 percentage points. Now its down to 58-12 (46 percentage points).
These numbers include RFK.
A modest shift of 18-29 year-olds from +29 to +24 for Biden is enough for Trump to win the electoral college 272-262, flipping Wisconsin, Arizona, and Georgia.
If we also make another modest shift in age group 30-44 from +24 to +20 for Biden, Trump wins 291-247, flipping Pennsylvania as well.
Bear in mind the swing state polls have Trump winning those age groups.
If we also adjust the Black percentages from Biden +82 to Biden +69, then Trump adds Nevada and Michigan making the electoral college vote 312-226. Yet, Biden still wins the national vote 50-48 causing howls.
Something like this is my base case and It’s my lead chart.
Why the Shift in Young and Black Voters?
I have addressed that question several times, but some new readers may not understand what’s happening.
Blacks constitute only 14 percent of the voting age population, but the swings toward Trump are so huge they could decide the election.
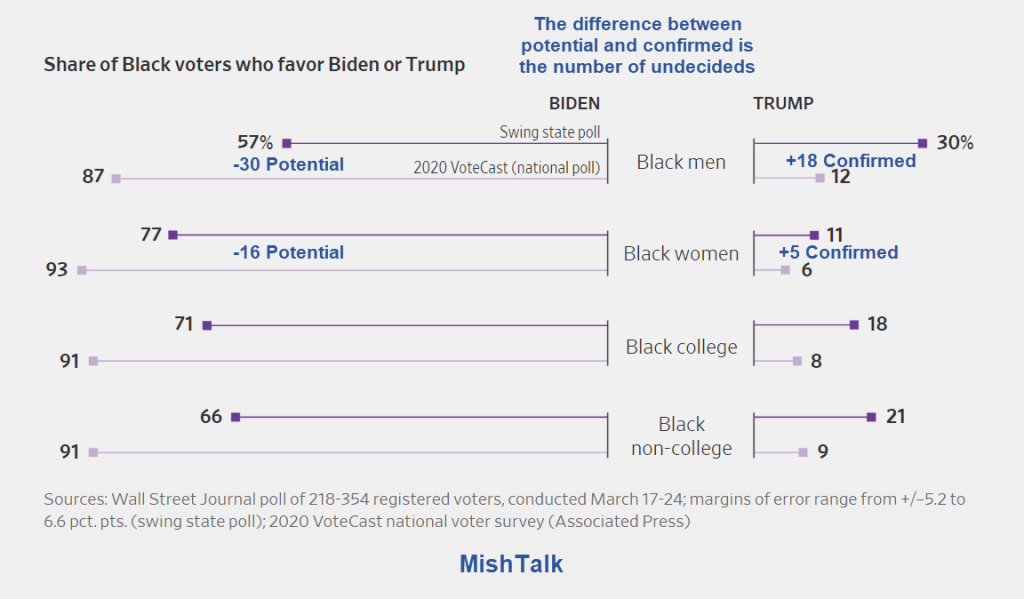
For discussion, please see Swing State Poll Shows Black Voters Abandoning Biden In Huge Numbers
While most Black men said they intend to support Biden, some 30% of them in the poll said they were either definitely or probably going to vote for the former Republican president. There isn’t comparable WSJ swing-state polling from 2020, but Trump received votes from 12% of Black men nationwide that year, as recorded by AP VoteCast, a large poll of the electorate.
Housing and inflation is the top issue. The cost of rent has gone up for 32 consecutive months by at least 0.4 percent per month according to the BLS.
Generational Homeownership Rates
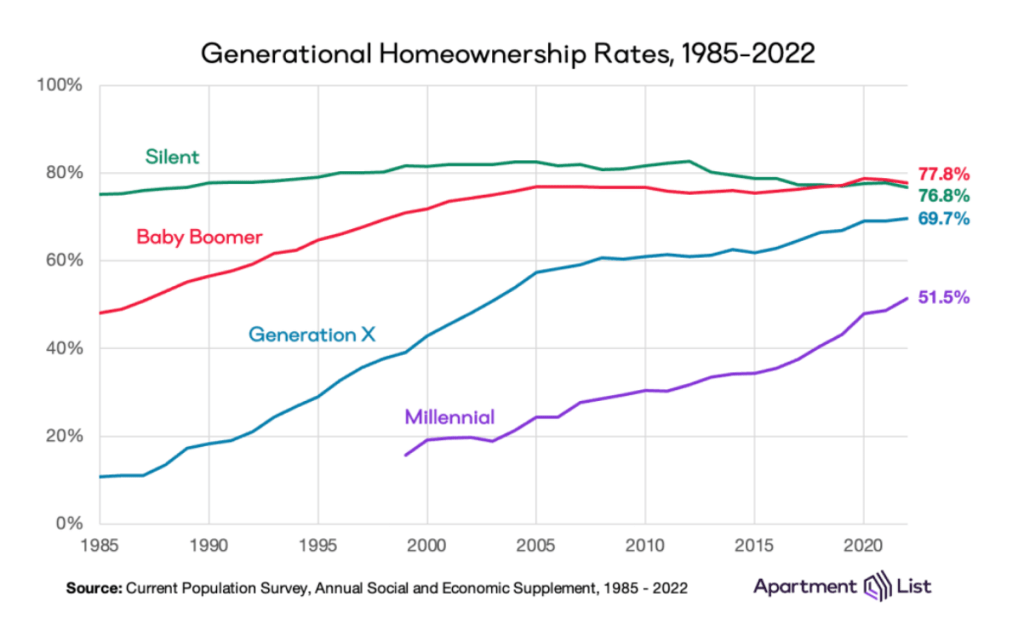
The Apartment List 2023 Millennial Homeownership Report shows Millennial homeownership seriously lags other generations.
Generation Z homeownership is dramatically lower still.
And according to the National Association of Realtors, the homeownership rate among Black Americans is 44 percent whereas for White Americans it’s 72.7 percent.
That’s the largest Black-White homeownership rate gap in a decade.
Q: What is it that young voters really have on their minds?
A: Rent
Renters Will Decide the Election
I tie everything together in my post People Who Rent Will Decide the 2024 Presidential Election
Q: Who are the renters?
A: Young voters and Blacks
That fully explains the massive shift in the polls among younger voters and Blacks. Factor in the immigration mess and a landslide is not out of the question.
best online pharmacies in mexico: mexican pharma – mexican pharmaceuticals online
п»їbest mexican online pharmacies
Semaglutide pharmacy price https://rybelsus.tech/# rybelsus cost
Rybelsus 7mg
semaglutide online [url=https://rybelsus.shop/#]cheapest rybelsus pills[/url] rybelsus coupon
https://rybelsus.shop/# rybelsus coupon
ozempic coupon: ozempic cost – ozempic cost
ozempic cost: buy ozempic – ozempic online
ozempic: ozempic cost – ozempic generic
https://ozempic.art/# ozempic
https://ozempic.art/# buy ozempic
buy semaglutide pills: semaglutide tablets – rybelsus price
buy ozempic: ozempic online – ozempic coupon
http://rybelsus.shop/# rybelsus coupon
http://rybelsus.shop/# semaglutide online
ozempic online: Ozempic without insurance – buy ozempic pills online
buy rybelsus online: semaglutide tablets – rybelsus coupon
buy semaglutide pills [url=https://rybelsus.shop/#]rybelsus cost[/url] semaglutide tablets
semaglutide online: rybelsus cost – semaglutide tablets
ozempic coupon: ozempic online – Ozempic without insurance
Ozempic without insurance ozempic buy ozempic pills online
semaglutide cost rybelsus price buy semaglutide online
https://rybelsus.shop/# rybelsus price
semaglutide tablets: semaglutide online – buy semaglutide pills
http://rybelsus.shop/# rybelsus price
https://rybelsus.shop/# buy semaglutide pills
buy ozempic pills online: buy ozempic – Ozempic without insurance
semaglutide cost semaglutide cost buy semaglutide pills
https://rybelsus.shop/# buy semaglutide online
пин ап казахстан: пин ап кз – пин ап казино онлайн
pinup azerbaycan: pinup az – pin up azerbaijan
pin up http://pinupru.site/# pin up
пин ап казино вход